Designing the Operating System for Private Market Operations

- Defined the entity model and data relationships that the entire platform is built on
- Designed the ingestion system that enforces data quality at the point of entry
- Established patterns for high-density financial tables reused across 12+ views
- Introduced the analytics layer adopted by operations leads for quarterly reviews
- Partnered with engineering to ship a shared component library for complex data views
- Product Manager
- Backend & Frontend Engineers
Overview
Alternative asset managers run their operations across a fragmented stack — CRMs, portfolio tools, spreadsheets, and custom internal workflows. No single system holds a consistent, complete picture of their funds, investors, or transactions.
This fragmentation compounds over time. Data is duplicated and contradictory between systems. Workflows that should be connected require manual coordination. And there's no reliable way to measure operational performance, so process improvements are based on intuition rather than evidence.
I led the design of Vega as a platform that structures data at the point of entry, provides a single operational interface, and surfaces analytics for continuous improvement. This case study covers the end-to-end system design — from data model to operational UI to insight layer.
The Problem
Data has no shared structure. The same investor exists in three systems with three different formats. No enforced schema, no referential integrity, no source of truth.
Operations have no single interface. Managing a fund means switching between tools. Context is fragmented, and workflows that should be connected require manual coordination.
Performance is invisible. Teams can't measure subscription conversion, identify process bottlenecks, or track engagement across their investor base.
Goal
Design a unified platform that:
- Enforces data structure at the point of entry
- Provides a single operational interface across all entities
- Surfaces analytics to drive process improvement
Outcome
- Single platform replaced fragmented tools and manual coordination
- Shared data model adopted as the foundation for all product development
- Operations teams gained measurable visibility into their own performance
Defining the System
Information architecture
The platform serves three fundamentally different user needs: getting data in, working with it day-to-day, and understanding what's happening at scale. Rather than treating these as disconnected features, I structured them as three layers of a single system — each feeding the next.

1. Data Hub (Input)
2. Workbench (Operations)
3. Analytics (Insight)
The data model
The most consequential design decision was defining the entity hierarchy. Every interface — tables, detail views, navigation, permissions — derives from this structure.
The model follows a strict hierarchy: Funds → Investors → Investments. Investors are split into Organizations (institutional investors like pension funds and endowments) and Individuals (high-net-worth direct investors). This distinction was critical — organizations carry compliance structures, multiple contacts, and layered approval chains that individuals don't.
Enforcing referential integrity at the model level means an investment can't exist without a linked investor and fund. This eliminates the orphaned records and broken relationships that plagued the previous spreadsheet-based workflows.
Supporting structures — Teams, Roles, and Permissions — sit across all three layers, scoped to individual funds.
Workbench
Making structured data operationally useful
Structured data in a database isn't useful on its own. Operations teams need to navigate across entities, see related records in context, and perform actions without losing their place. The Workbench is the operational layer that makes the data model usable.
Design principles
One system, multiple perspectives. The Fund view answers "What's happening in this fund?" The Investor view answers "What's this investor's position across funds?" Same underlying data, different navigational entry points.
High density, controlled complexity. Financial operations demand data density. The interface uses structured tables for scanning, expandable rows for detail, and consistent column logic across all entities.
System consistency. Shared interaction patterns across Funds, Investors, and Investments. Predictable navigation, consistent actions. No concept appears in two places with different behaviour.
Funds
The fund view is the primary operational surface. From a single fund, users can access investor lists, subscription status, opportunities, and investment positions — all scoped to that fund's context.


Investors
Investors are split into two entity types that reflect a real structural difference in how alternative asset managers operate:
Organizations — Institutional investors like pension funds, endowments, and sovereign wealth funds. They carry compliance structures, multiple contacts, board-level approval workflows, and participate across multiple funds simultaneously.
Individuals — High-net-worth direct investors with simpler profiles, but who still participate in the same fund and investment hierarchies.
Both share a common relationship to funds and investments, but their data requirements, compliance obligations, and operational workflows differ enough to warrant distinct interfaces.


Data Hub
The ingestion problem
Users weren't creating data in Vega. They were migrating it from Salesforce, Investran, Excel, and internal systems. The data was inconsistent, differently structured, and often contradictory between sources.
The design challenge wasn't building an upload form. It was creating a system that converts messy, multi-source data into a structured model with enforced relationships — without requiring users to understand the underlying schema.
Overview
The Data Hub surfaces all entity types with dependency labels, record counts, and 12-month activity sparklines. Teams can assess ingestion health at a glance and identify which entities need attention.

Every import is logged with data type, record counts, uploader, and status — creating a full audit trail that satisfies compliance requirements.

Ingestion flow
The import follows three stages: download a structured CSV template that mirrors the entity schema, upload and validate with inline error detection, then import in a dependency-aware sequence.
Validation surfaces row-level issues before data is committed. Rows are flagged as ready, warning, or error — with missing or invalid fields highlighted inline. Users can fix issues in place, bulk-delete invalid rows, or re-upload a corrected file.

Dependency ordering prevents referential integrity violations. Organizations must be imported before Users, which must exist before Investing Entities can reference them. The system enforces this sequence automatically.
Analytics
Turning operations into a measurable practice
Before Vega, operations teams had no visibility into system usage, workflow throughput, or subscription performance. Decisions about process changes were based on intuition rather than data.
The analytics layer provides four views, each designed for a specific operational question.
Investor portal sessions
Tracks platform usage across the investor portal — login frequency, engagement rates, user type breakdowns, and resource access patterns. Surfaces which investors are active and which have gone stale, enabling proactive outreach.
Workbench sessions
Internal usage metrics showing team adoption, login patterns by role and device, and engagement trends across the operations team.

Efficiency metrics
Task-level operational metrics — completion rates, resolution times, and team breakdowns — to identify bottlenecks and measure the impact of process changes over time.

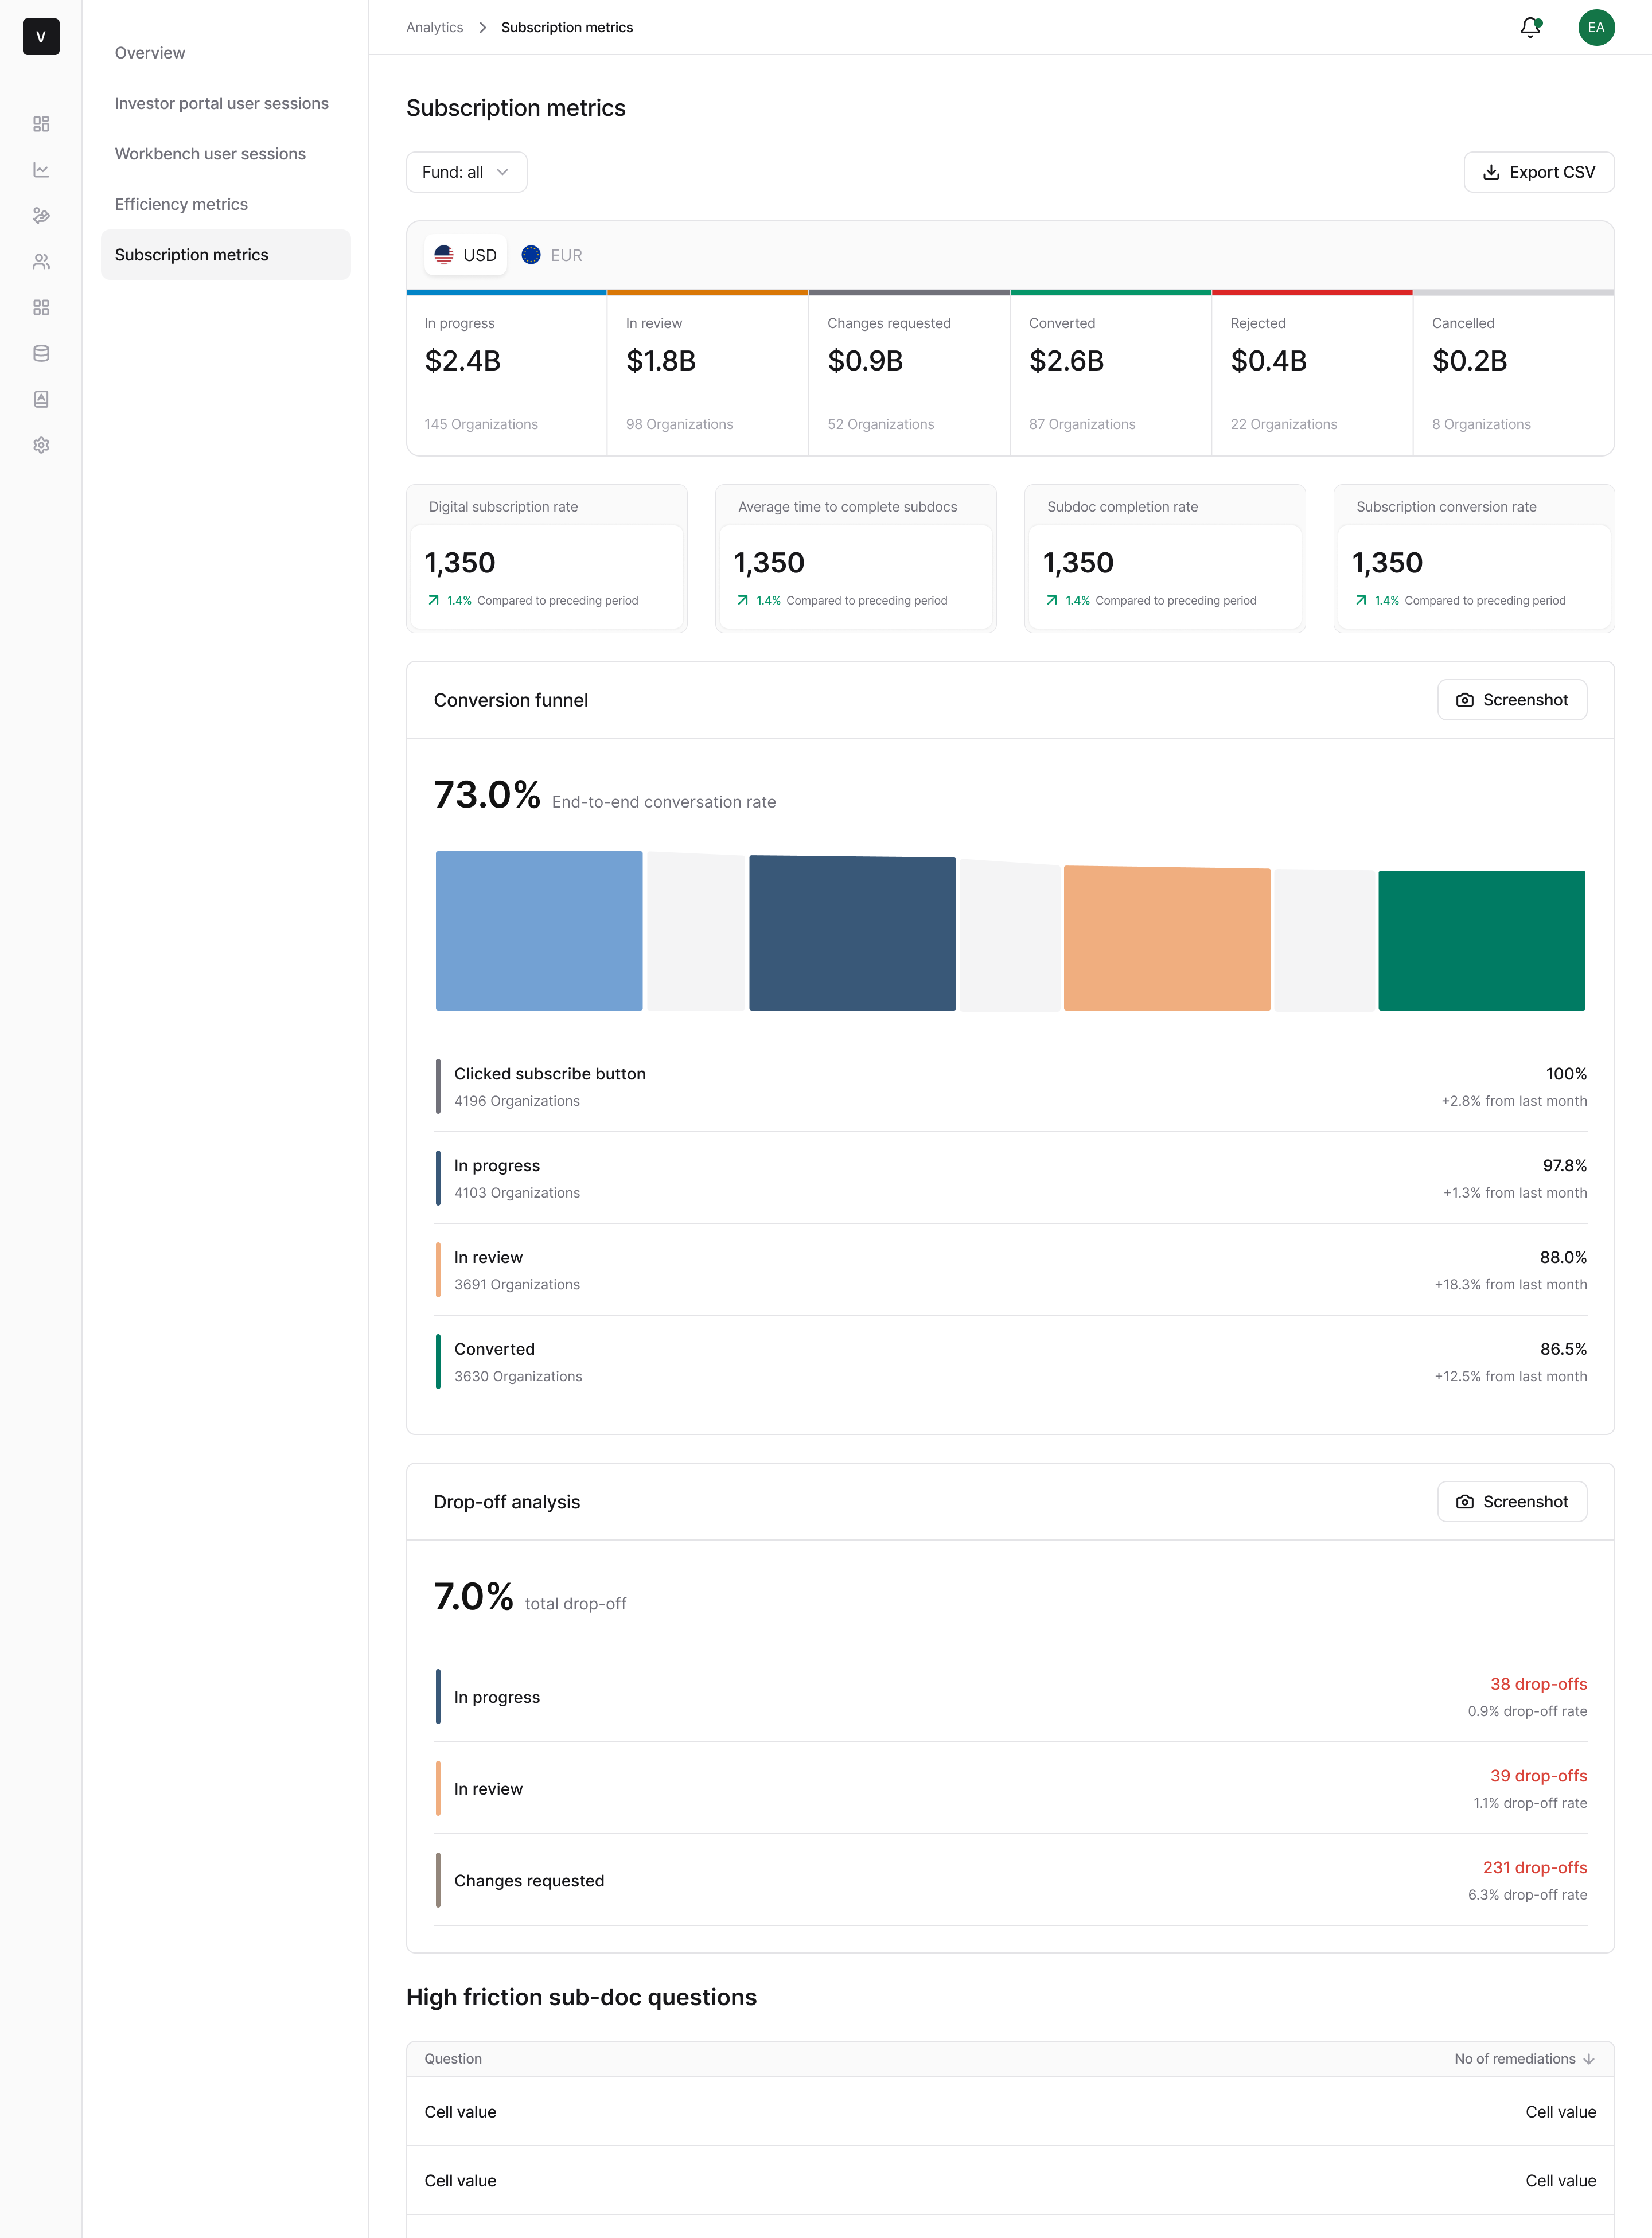
Subscription metrics
The highest-stakes analytics view. Tracks the full subscription funnel from initial interest through conversion, with pipeline values by status, drop-off rates at each stage, and identification of high-friction questions in the subscription documents.
Teams & Permissions
Modelling real organisational complexity
A single person might be an Investor Services lead for one fund and a Compliance reviewer for another. The permissions model needed to reflect this reality — role-based access scoped to individual funds, with flexible user-role relationships that match how alternative asset managers actually operate.

The detail view provides two perspectives on the same data. Grouping by role shows all funds a user accesses in a given capacity. Grouping by fund shows all capabilities a user has within a single fund. Both views exist because admins need both questions answered: "What can this person do?" and "Who has access to this fund?"


Roles
Roles define what a user can do within the system. Each role carries a set of permission groups — granular access levels for entities like Funds, Investments, Opportunities, and Organizations — with controls for view, create, update, delete, and approval actions.


Impact
- Replaced spreadsheet-based workflows for fund and investor management
- Single source of truth adopted across all active funds
- Analytics layer used for quarterly operational reviews
- Entity model became the foundation for all subsequent features
- Table patterns and interaction library reused across 12+ views
- Aligned product and engineering around a shared data model
What I Learned
The data model is the product. The hardest and most impactful decisions weren't visual — they were structural. Getting the entity hierarchy right determined whether every downstream interface would feel coherent or fragmented.
Designing constraints creates better systems. Enforcing referential integrity at import felt restrictive initially. In practice, it eliminated entire categories of data quality issues that had plagued the previous workflow.
Insight completes the loop. A system that ingests and operates but can't measure itself is incomplete. The analytics layer turned Vega from a tool into a practice — one that improves with use.